GA Q8
MCQ2 marks, −0.67The pie charts depict the shares of various power generation technologies in the total electricity generation of a country for the years and .
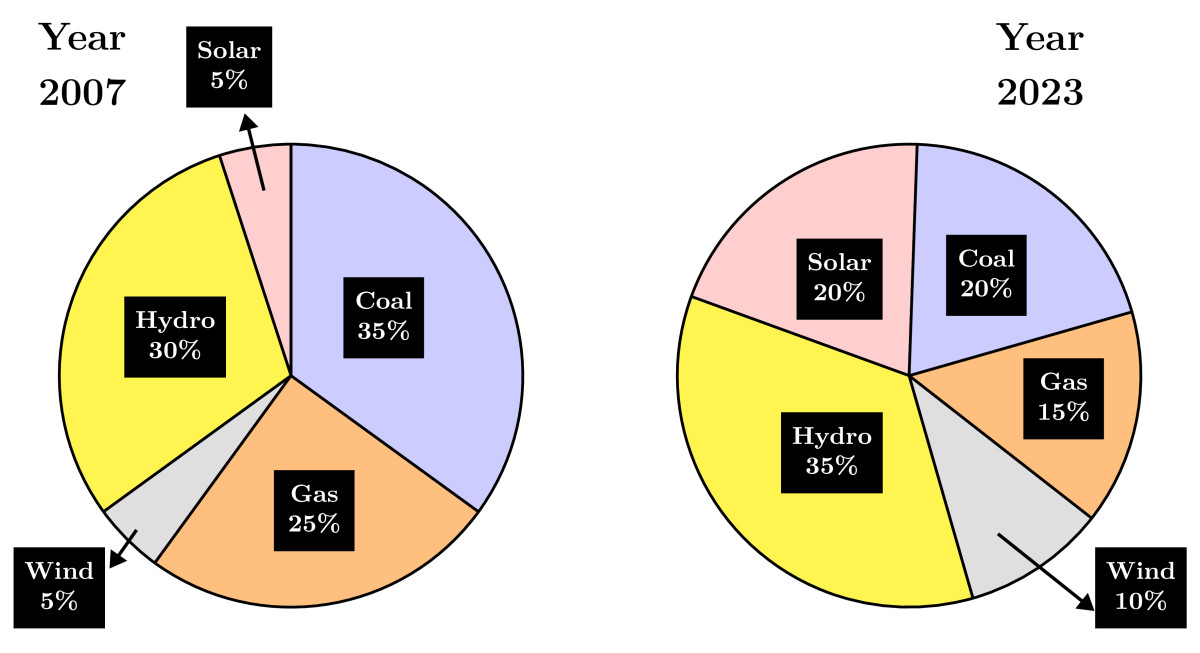
The renewable sources of electricity generation consist of Hydro, Solar and Wind. Assuming that the total electricity generated remains the same from to , what is the percentage increase in the share of the renewable sources of electricity generation over this period?
Sign in to save attempts.
Loading…