The pie chart presents the percentage contribution of different macronutrients to a typical 2,000kcal diet of a person.
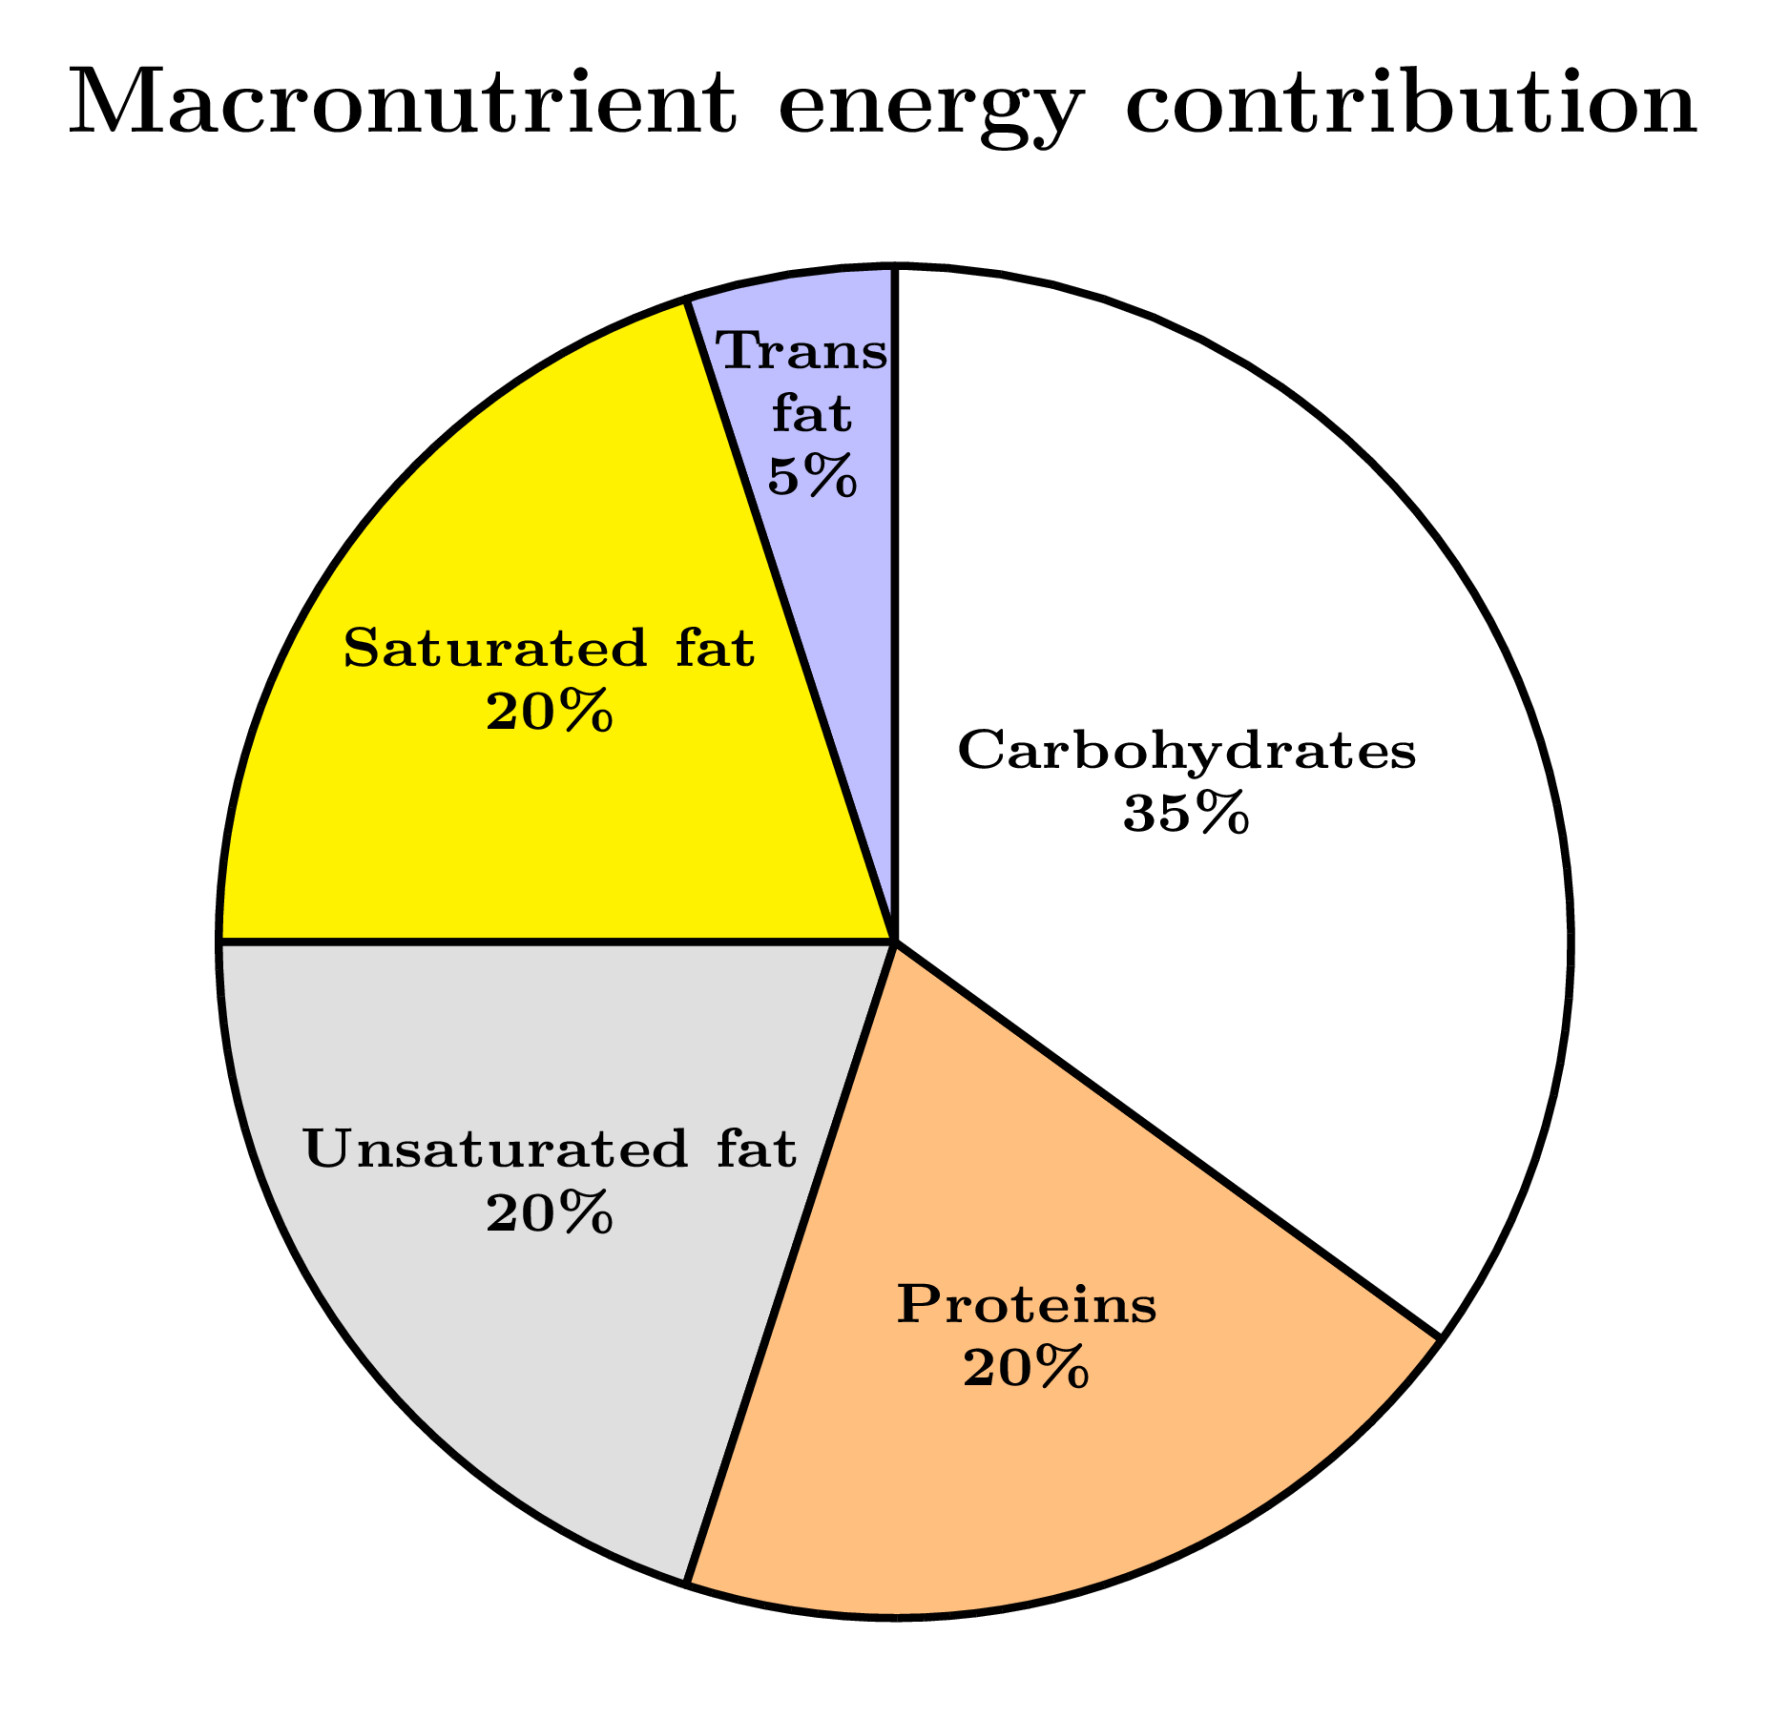
The typical energy density (kcal/g) of these macronutrients is given in the table.
MacronutrientCarbohydratesProteinsUnsaturated fatSaturated fatTrans fatEnergy density (kcal/g)44999
The total fat (all three types), in grams, this person consumes is