GA Q10
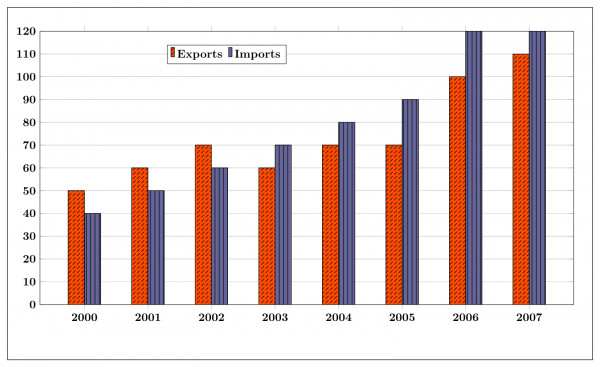
NAT2 marksThe exports and imports (in crores of .) of a country from the year to are given in the following bar chart. In which year is the combined percentage increase in imports and exports the highest?
Sign in to save attempts.
Loading…
The exports and imports (in crores of .) of a country from the year to are given in the following bar chart. In which year is the combined percentage increase in imports and exports the highest?
Loading…